

In the past couple of years, volatility in markets and the speed at which capital is moving between asset classes have picked up immensely. Trends that used to take years to unfold are now taking months. Much of this has to do with the geopolitical environment and the major changes sweeping across industries as we try to figure out how artificial intelligence fits into the future picture.
Rather than react to each headline, we track a handful of measures each month. They don't necessarily predict, but they do tell us where things sit relative to history. This is usually the most useful question when it comes to planning. Here is what the metrics say today:
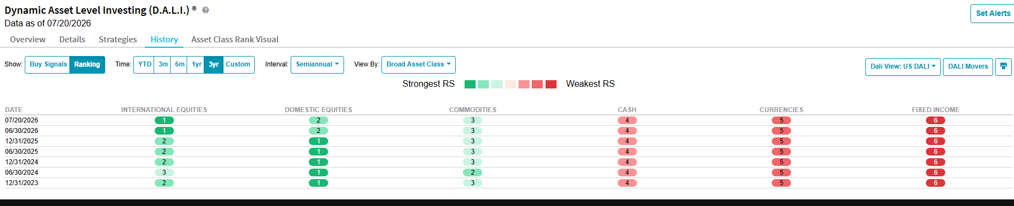
Trend is constructive - Equities continue to lead, with international recently taking the top spot over the US, followed by commodities, cash and currencies, with bonds trailing. This ordering has largely held since the bull market began in late 2022.
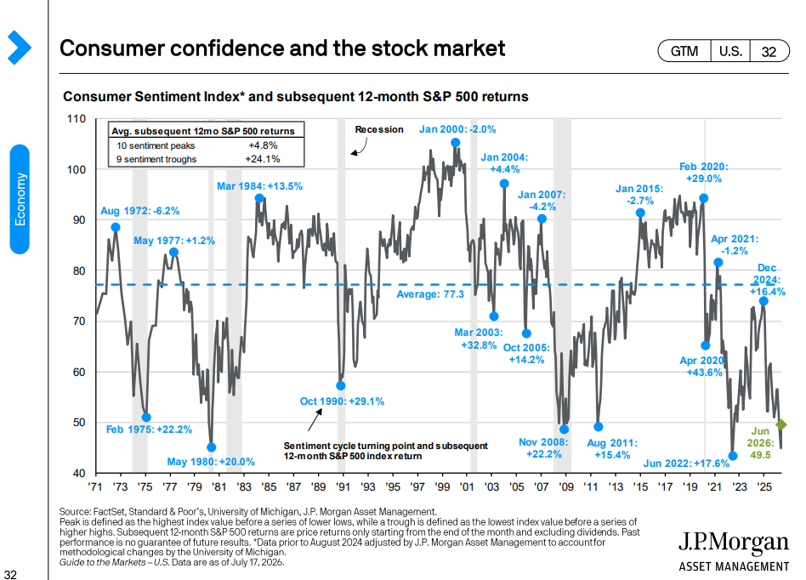
Sentiment is deeply pessimistic - near the lowest readings we have on record. Historically, that has been a more favorable backdrop for forward returns than euphoria has. However, context matters. We have to look at price relative to sentiment, the trend, and to valuations.
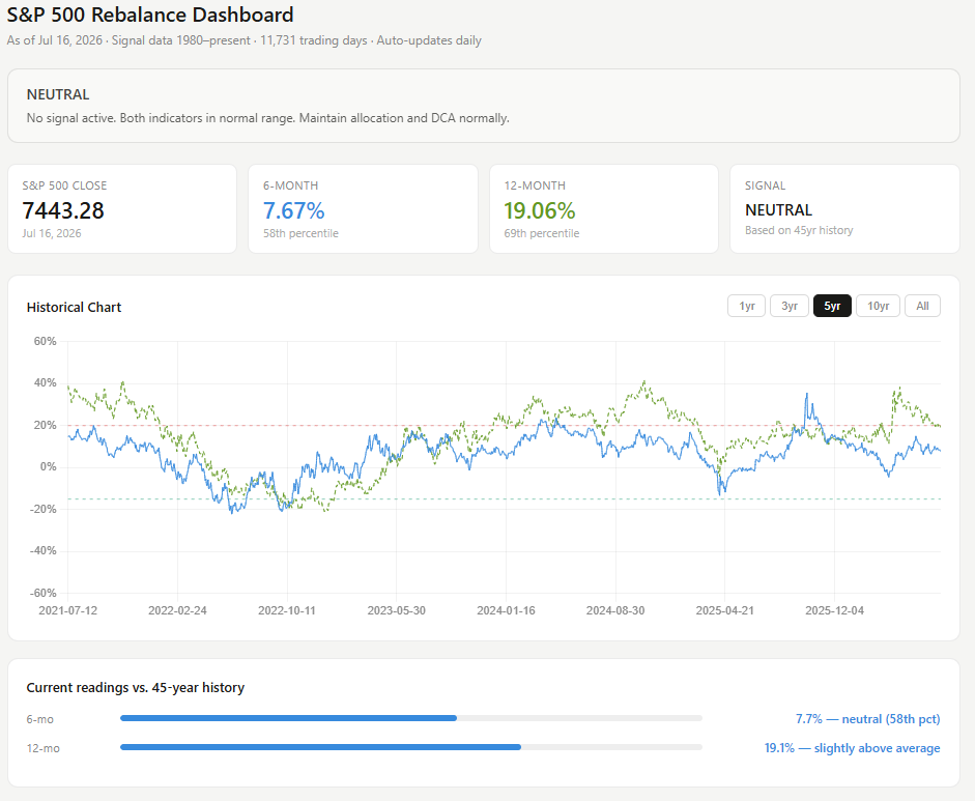
Prices are moderately extended, not extreme: Our dashboard puts us in the middle-to-upper end of the historical range, a step down from the more cautionary readings we saw in May and June.
Valuations are elevated, but the more important story is dispersion. The gap between the expensive and the overlooked is unusually wide, which is why we’ve seen leadership rotate so swiftly and sometimes violently.
AI is real and early. We think we are still in the infrastructure phase of a multi-decade buildout, while exciting and worth looking into, it is not historically where durable returns are made.
Deeper Dive on Trend, Sentiment, Valuations, AI and Bitcoin:
TREND: At a high level, we look at the overall trend of the primary asset classes: stocks, bonds, commodities, currencies and cash. Equities continue to lead, with international more recently taking first place and US Equities moving to second, followed by commodities, then cash, currencies, and bonds pulling up the rear. For the most part, this trend has been in place since the beginning of the bull market that started in late 2022, early 2023. Risk assets, so to speak, are still leading the way.
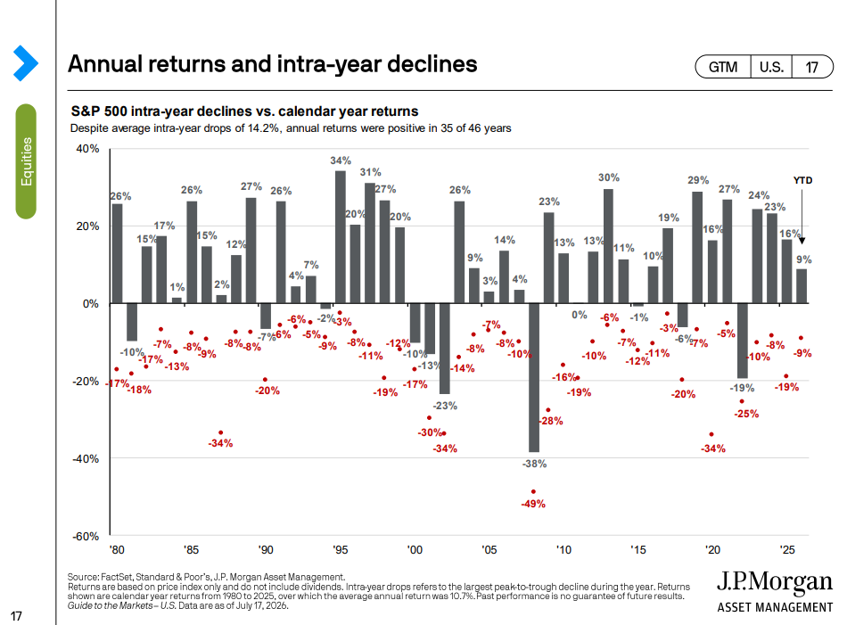
We like to also keep an eye on general market returns. Doing so helps to not get too carried away during euphoric runs and not too depressed during deeper drawdowns or lows. This helps us with our rebalancing decisions and throttling up or down our equity exposure. Currently, we are nearing the upper middle end of the range. An area that typically requires attention but not necessarily concern.
Sentiment: Market sentiment is just as important as following the overall trend and annual returns. However, it works better if you view it from a contrarian lens. Like what we saw in the previous chart. When the general market is the most pessimistic, future returns tend to be higher. When the market is most euphoric and expects the good times to continue, markets tend to do less well in the future. Today, we stand at one of the lowest readings on record. This does not mean we will definitively have positive markets. It is just one measure, but it does show how stocks can grind higher in the face of “bad news”. This metric is a good emotional gauge.
Relative Price: Looking back at S&P 500 prices from 1980 to now on a six- and twelve-month basis can help us get a feel for relative “expensiveness” to the past. In both cases, we are in the middle to upper end of the range. Meaning we are slightly above neutral, maybe a 6 to 7 on a scale of 1 – 10. For reference, in May and June we were much more elevated before the market took a swift breather.
What the current reading tells us is that over the last 46 years, 58% of six-month trend of prices have been lower than today’s and 69% of twelve-month trend of prices have been lower than today. So, we are slightly elevated but not overly so.
For perspective, in June we were in the 74th percentile (6mo) and 87th percentile (12mo) or in a cautionary state. The S&P 500, while having moved up and down in the last few months, is in relatively the same place as it was in early May. This lets us know that while the trend is still intact, it’s become a little harder to move higher. So, before making any significant changes, we should let the market tell us which direction it prefers to go.
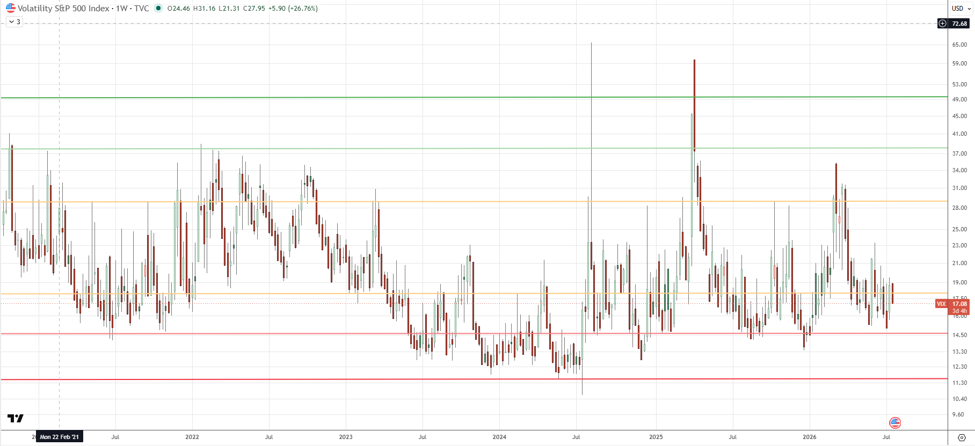
Volatility: Together, these few data points help us better understand the volatility we are seeing in the markets. While volatility has generally been tame, it has increased in recent years. A lot of that has to do with how much faster news moves today than it ever has in the past.
Again, taking the contrarian side, what we’ve seen is that when volatility compresses below 14, it has been a better signal for trimming, and when it spikes above 18-20 it’s been a better buying environment. In the context of wealth management, we don’t so much need to use this as a trading tool but more so as a rebalancing tool. Typically, it is better to generate cash for expected future expenses when prices are high. And when prices are low, look to deploy cash we know will not be needed for 12 months or more.
The VIX – volatility index – is a fear gauge. As we saw in the annual drawdowns chart and in the sentiment chart, high levels of fear and negative sentiment tend to be correlated better with long-term positive future returns. Looking specifically at this chart, some of the better buying opportunities in the past five to six years have presented themselves when the VIX was above 28, or even higher than 37. These ranges also mark historically high levels of fear in the markets.
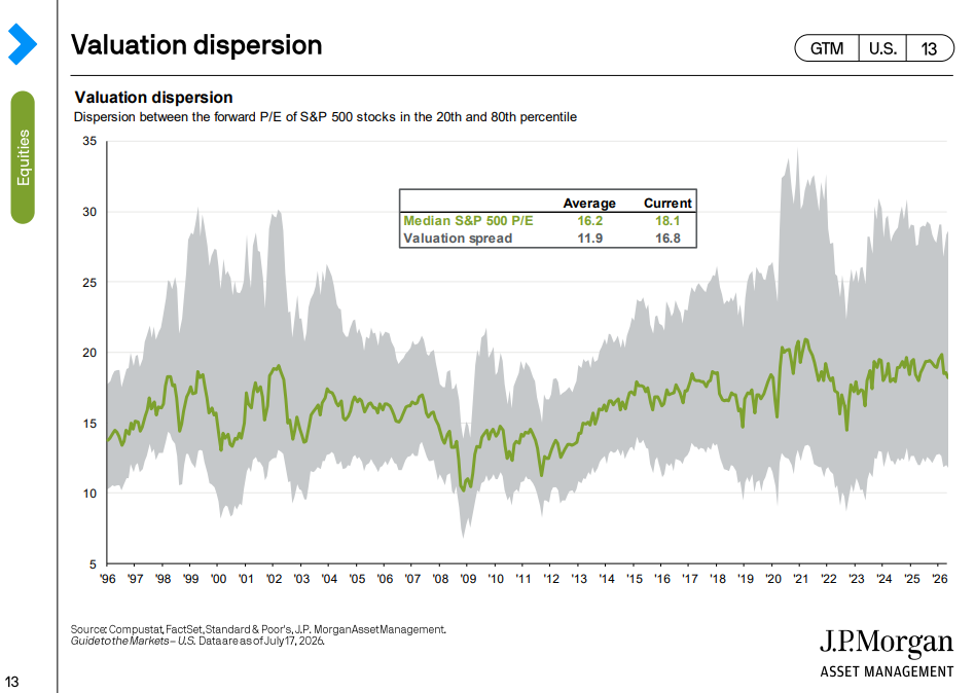
Valuation: Putting it all together makes the below valuation chart make more sense. At this point, we’ve all said it or at the minimum read it. Stocks are expensive. Valuations don’t make sense, but everything keeps going up.
While this happens in markets from time to time, framing all the above with the chart below helps us to make more sense of the rotations and fluctuations we’ve seen. While stocks in general do have elevated valuations, this can persist and has for the last few years. Despite all the inflation (we’ll discuss below), over the past 12 months, some of the left-for-dead sectors like energy, value, international and the other 493 companies of the S&P (non-MAG7) have done well.
While the MAG7 has flatlined a little, AI has gone through the roof, and commodities and industrials have had great runs. What this chart tells us is exactly this. The average price-to-earnings ratio (P/E) is slightly elevated (18.1 vs. 16.2 or +12%), but more importantly, the dispersion of what is and what is not overvalued is much more elevated (16.8 vs. 11.9 or +41%). Meaning, in some sectors greater opportunities exist while in others greater risks exist than they normally do. i.e., volatility is everywhere. Some sectors that have been left for dead (oil, value, international) are doing well, and some sectors that have been overhyped (AI and hyperscalers) are starting to come back down to earth a little.
The rotations between these two factions are normal, but overall, it’s a much wider dispersion than we’re accustomed to. In fact, the dispersion (width of grey) is much closer to 1998 to 2004 than it is to the mid-2000s. For context, we should manage our emotions around specific stocks and sectors appropriately and seek to deploy cash when sentiment is bad and raise cash when euphoria is near peaks.
AI, Bitcoin, Macro, and Inflation:
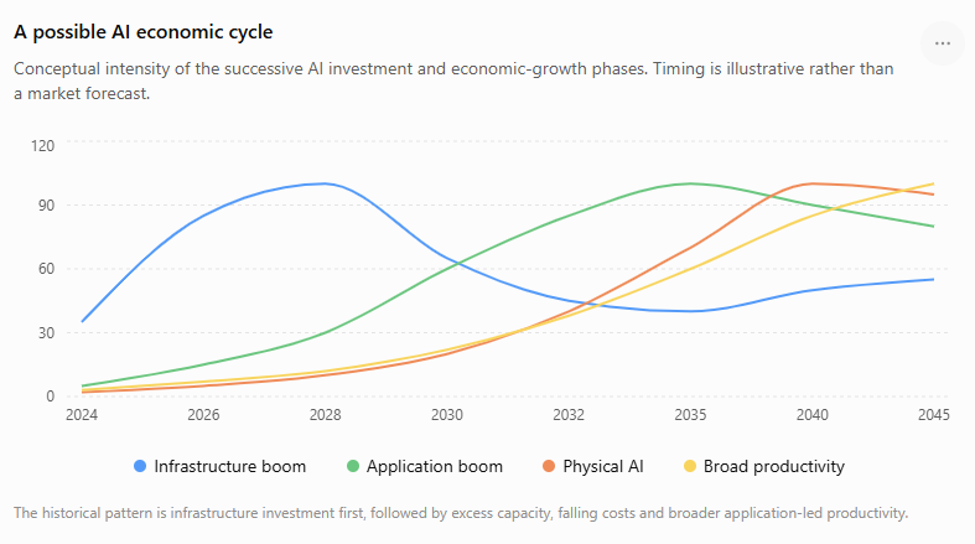
AI: All markets follow a general cycle. AI is new. It is a powerful technology, and I believe it is and will continue to change the world. In ways we can’t even think of today. Very much like the internet before it did.
Having said that, capital deployment and infrastructure buildouts are typically the first wave, not the last (blue line below). The applications of AI are still yet to come. Outside of the infrastructure and chip layer, there are very few application layer companies publicly tradable today. So, after the boom and bust of infrastructure, we tend to see these players come to market. In my opinion, this is where the decade-long cycles begin (green). Assuming success, eventually every company becomes an AI company. Much like today when almost every S&P 500 or Dow Industrial company has information technology, SaaS, email, and the internet at its operating core. The internet is what powers all our basic business and lifestyle infrastructure (orange), and most likely AI will as well, once we reach the mass adoption stages. During this stage, intelligence, inference, and what comes next will eventually become a core commodity like power, water, gas, email, cloud, etc. That's what makes the long arc of the orange line important.
The chart below is one I created to depict how new innovations create the levers that allow human and economic productivity to grow (yellow). This is not just a means to time the AI buildout, but it more or less shows how major innovations come in waves. We’ve seen this in all major network technologies of our past: the railroad system, oil & gas industry, telecom system, banking - credit and ACH network systems, and most recently with the Internet and social networks. Life-altering network technologies all follow a very similar pattern, and their rollouts consist of a few different boom-and-bust cycles that reshape economies as they unfold. We are in the early innings of a new wave with AI.
Bitcoin: From my perspective, the 4-year Bitcoin cycle remains intact. The top at $126k came right on schedule this past October. As you can see below, the current bear market is so far almost exactly in line with Bitcoin’s past bear markets.
There are some subtle differences, but not yet enough to unwind the 4-year cycle. Though I do believe at some point this will change because it is a natural path for nascent assets to be adopted into the global financial system. Regardless of news headlines related to Bitcoin’s price falling, the fundamentals remain unchanged for now. However, we now have the full attention of governments, policymakers, and bankers, so we’ll see how long this lasts.
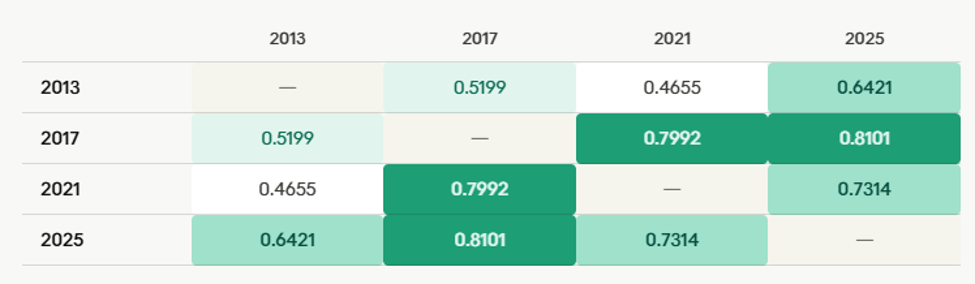
At some point, Bitcoin’s reliable pattern will start to shift. In the chart below, I have indexed each of the four Bitcoin bear markets since 2013. While we are slightly higher than the last three cycles, in terms of price, we are relatively right on track in terms of days within the cycle.
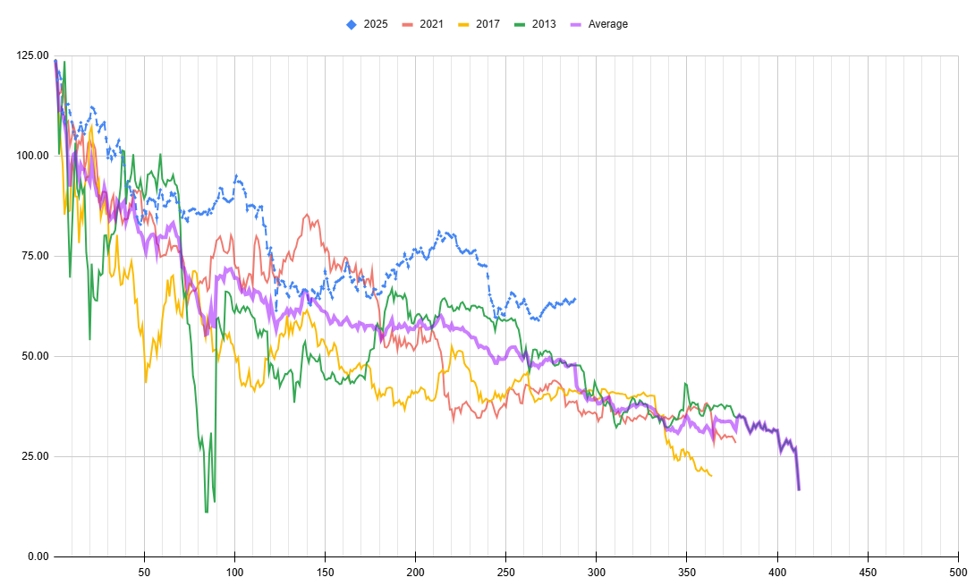
The current bear market is roughly 65 to 80% correlated to past Bitcoin bears, or 73% on average. That’s a little hard to ignore and comforting at the same time. From this perspective, there may be more downside to go, but until something materially changes, Bitcoin is cheap relative to its past.
Macro Outlook:
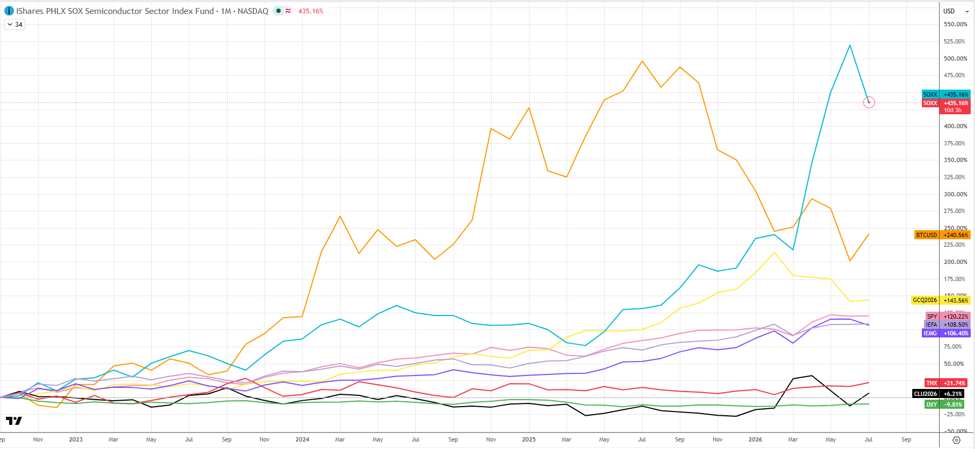
Asset Class Rotation: In the chart below, we are looking at how the primary asset classes have performed in this most recent cyclical bull market (since the 2022 low). We have the dollar, DXY (green). 10yr Yields/rates (red), Oil (black), Gold (yellow), Bitcoin (orange), S&P 500 (pink), International and Emerging (purple and light purple), and Semiconductors/AI (light blue).
The first thing to notice is that the dollar is merely the unit we either decide to hold out of fear or sell for something else that we expect a better return from.
From the most recent bottom in September 2022 until about September 2023, notice that every asset class trended together. As inflation was picking up (yields rising), capital began flowing disproportionately to different sectors - see the Valuation Dispersion section above.
If we dig a little deeper, we can see how inflation, rising rates and policy actions have impacted capital flows.
Going back to early 2021, when rates began rising, we can see that all assets pretty much moved higher in unison. In late 2021, when inflation really began taking its toll, we entered a two-year bear market as rates rose at some of the fastest paces in history. In those early stages, only oil held pace.
By the time rates peaked in late 2023, most assets had begun recovering, pulling money out of oil and evenly into other markets. In 2024, we began seeing larger dispersions with Bitcoin running hot, the early beginnings of AI outpacing stocks, and gold moving but not reacting to inflation as one would typically expect.
It wasn’t until mid-2025 that we saw another swift change. AI, gold, and stocks took off, though stocks petered out shortly after in relative terms. Bitcoin entered its top and came crashing down, and oil fell behind all asset classes.
During the most recent spike in rates (2026), we saw another material shift. AI climbed to meteoric heights as fears of a SaaS-pocalypse set in, oil finally caught up with the help of the war in Iran/Strait of Hormuz, and the air was let out of the “Debasement Trade”. The latter sent metals (gold) and Bitcoin back down.
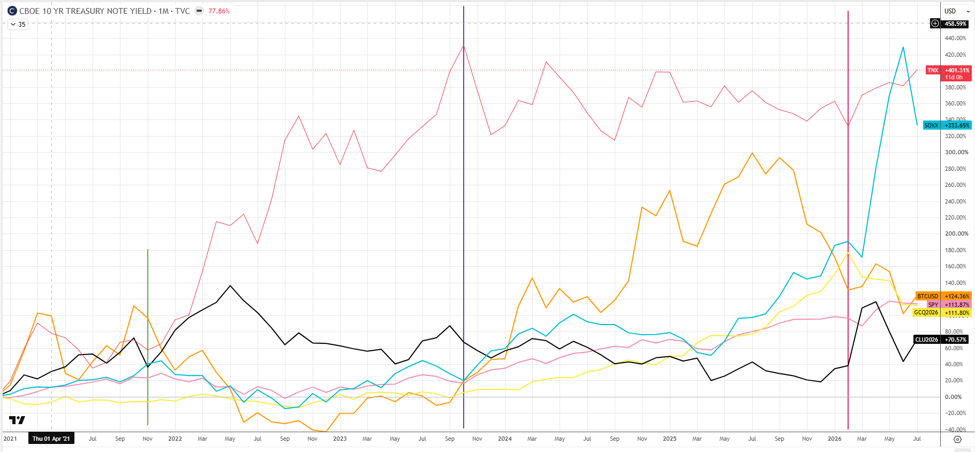
Where one market goes versus another is hard to tell, but as we’ve seen in the past couple of years, the primary drivers are fears around inflation and the dollar. Each period’s leadership was caused by swift movements in these two instruments.
So… What Now?
Equities: Remain invested, but increasingly favor diversification over concentration. International and previously overlooked areas of the market deserve meaningful exposure.
Cash: Maintain enough liquidity for known spending needs so market volatility doesn't force asset sales at the wrong time.
Fixed Income: Bonds remain behind other major asset classes in our trend work, but higher yields can be attractive for some parts of portfolio stability.
Alternatives: Gold, Bitcoin and other diversifiers can play a role around the edges of a portfolio, but sizing matters more than predicting which will lead next.
AI: We believe the theme is real and potentially enormous, but today's infrastructure winners will not necessarily be tomorrow's application winners. We want exposure without allowing enthusiasm to overwhelm valuation discipline.
Markets rarely move in straight lines, and neither should a financial plan depend on them doing so. Our job isn't to correctly predict every rotation. It's to maintain enough liquidity that we aren't forced to sell during periods of stress, enough exposure to productive assets to participate in long-term growth, and enough flexibility to take advantage of opportunities when markets inevitably become uncomfortable.
Today, the trend remains constructive, but valuations and dispersion tell us to remain selective. That means staying invested, rebalancing after strong runs, maintaining appropriate liquidity for near-term needs, and being willing to deploy capital when volatility creates better opportunities.
The goal isn't to avoid volatility. It's to structure your wealth so volatility can work in your favor rather than against you.

.png?width=352&name=Market%20Dial%20(2).png)