Navigating Market Volatility: 2023 3Q Recap and Insights
Kane McGukin | October 06 2023
Financial markets ebb and flow over time. Some months or years they are up and others they are down. For the month of September, the S&P 500 was down a little over -4%, though on the year the index is still up about 12%.
As we wrap up the third quarter of 2023 we wanted to take a minute to give you a brief update of some of the high points we think warrant attention.
As always, we rely on our Three Dials for the basis of our investment philosophy which we update monthly. The dials remain slightly defensive this month. Below are four additional charts we found interesting.
The Top 10 Names in the S&P 500
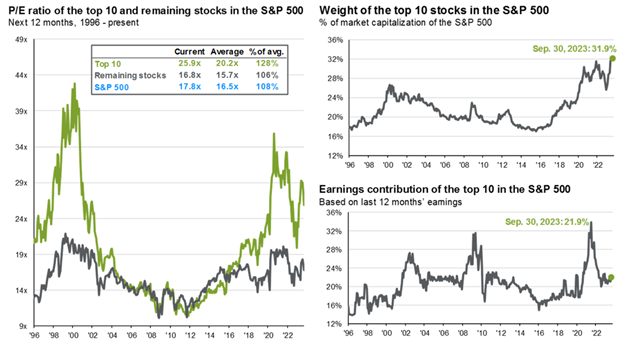
The S&P 500 (SPY) is predominantly powered by the top 10 stocks in the index (AAPL, MSFT, AMZN, NVDA, GOOGL, TSLA, META, BRK.B, UNH, XOM).
Most of the S&P's returns have come from these few names. They are once again expensive on a historical basis, while the remainder of the index is roughly in line with historical valuations (Chart source: JP Morgan).
Since 2022, the earnings contribution of the top 10 to the index has fallen, pointing to how expensive these names are after this year’s first half rally.
Since the S&P 500’s high in July 2023, the index is down about -7%, while these names have fallen anywhere from roughly -8% to -29%, with most selling off about -13% or so.
Note: UNH and XOM, the value names, are up almost 13% and 6% respectively. The highflyers on the other hand have sold off.
Interest Rates: Higher For Longer?
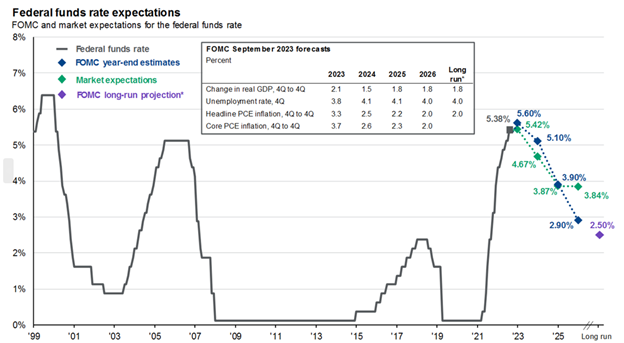
Higher for longer has been the FED’s stance on interest rates in an attempt to squash the monetary inflation caused by excessive printing during 2019-2022. For the most part, market expectations have cornered the FED into making adjustments over the past two years.
Rates could still rise from here. However, the market is suggesting the FED will need to cut rates in coming years to offset the pressure rising rates have put on the economy.
Bonds become appealing when Treasury and other fixed income yields reach 5.50% and above, especially in anticipation of rate cuts.

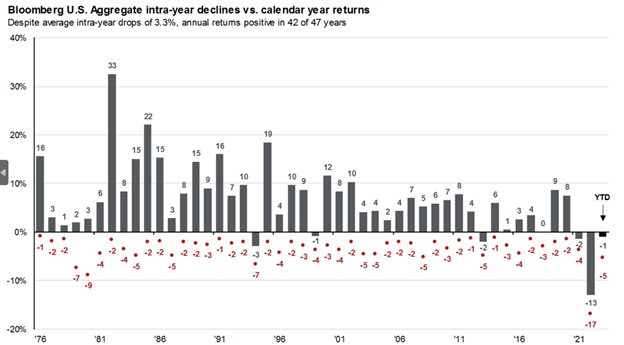
Historical Stock & Bond Market Declines
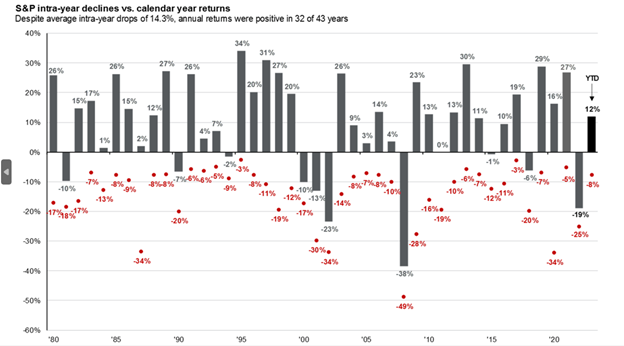
Regardless of where stocks finish the year, on average, they have typically seen an intra-year decline of around -14.3%.


Once again, we rely on our Three Dials investment process, but these are a few market insights we found interesting as we close out the third quarter and head into the back half of 2023.
For more blogs, podcasts, and other financial content, check out our resources page.
Disclaimer: Our intent in providing this material is purely for informational purposes, as of the date hereof, and may be subject to change without notice. This article does not intend to constitute accounting, legal, tax, or other professional advice. Visitors and readers should not act upon the content or information found here without first seeking appropriate advice from a trusted accountant, financial planner, lawyer or other professional.
Join us:


